College Football Coaching Salaries
Web Scraping to Find the Price Per Student by School, State, and Conference
 on [Unsplash](https://unsplash.com?utm_source=medium&utm_medium=referral)](https://cdn-images-1.medium.com/max/8064/0*Ds0YELsm_wjuT8UX)
As I am writing this story, the 2020 National Championship game is playing in the background. The pageantry of the college football playoff system rivals that of the NFL’s own tournament bracket, however, this is orchestrated by a non-profit. A non-profit reaping billions in ad revenue, TV deals, and merchandise licensing then distributing to the member institution’s athletic departments. All this money has to go somewhere right? In a strange paradox, these academic institutions spend millions to recruit the top coaches and many millions more to support the big name coaches with capable assistants. The justification for such spending is to compete internally in the NCAA to recruit the best staff to succeed and receive an even larger distribution of the non-profit’s revenue stream. More articles about coaches salaries in college football can be found [here], [here], or [here].
The main goal of this article is to show the price of a college football staff per student. Granted, students do not typically bear the brunt of the athletic department’s spending, however, it is interesting to see how much a school, state, or conference spend by population. Clemson students pay the most per student in our dataset and have the highest paid staff in college football. The roughly $17.3 million spent a year on the coaching staff equates out to about $693.42 per student. LSU ranks 12th in both price per student and total staff costs with $362.50 and about $11.1 million spend per year. Wow! The code to see this for yourself or to find your own school is found on GitHub.
College Football Salary Data
To pull the data of college football head coaches, assistants, and strength coaches, we used the USA Today college football database. A table web-scraper function is created based on this wonderful article using requests, lxml, and pandas to pull the tabular information. Additionally, college football team locations and estimated enrollment figures are scraped from Wikipedia. The USA Today database is missing coaches salaries from 8 schools (6 private universities and 2 military academies).
Salary Information By State
In order to visualize the spending by states on college staffing, we need to create a choropleth graph. To build our choropleth, we use plotly. We create a new column with state codes using a dictionary lookup to build our plot. If you run the jupyter notebook interactively each state with a D1 football program displays the amount spent, the number of schools in that state, and the total enrollment.
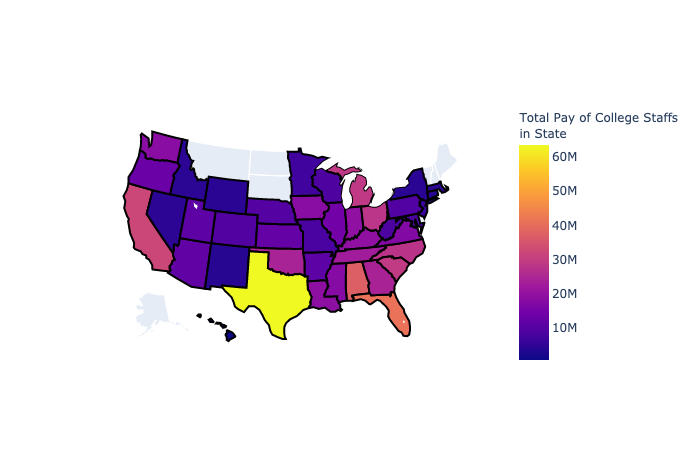
Texas leads overall staff spending, which makes sense given it has the most D1 college football teams. The number of teams affects this graphic. To overcome team densities, we create an average spending per team in a state by dividing the aggregated spending by the number of teams.
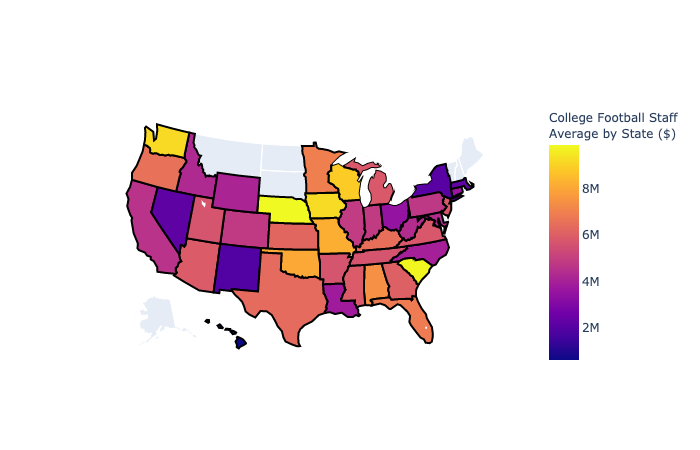
States like Nebraska and South Carolina (driven by the spending of Clemson) lead the average price of football staffs per team by states. Average coaching salaries in hot beds of football (Florida, Texas, and California) are usurped in terms of average spending per state program by states with only one team, such as Wisconsin. This makes sense since there are so many teams in some of these larger states and many of these teams are in lower conferences with less overall revenue. Conferences inform the salaries of coaching staffs.
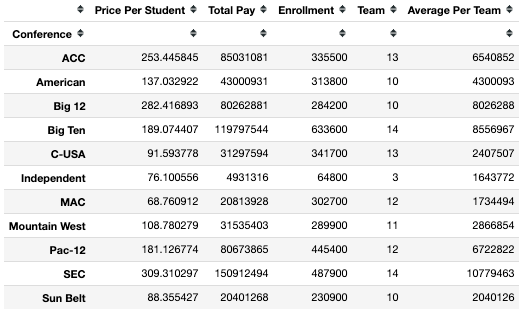
The SEC has the largest overall spending and average spending per team. The SEC also leads the nation in college football staff spending price per student with a cost of $309.31. The price per student is a function of the aggregate of salaries in a conference or state divided by the aggregate of enrollment.
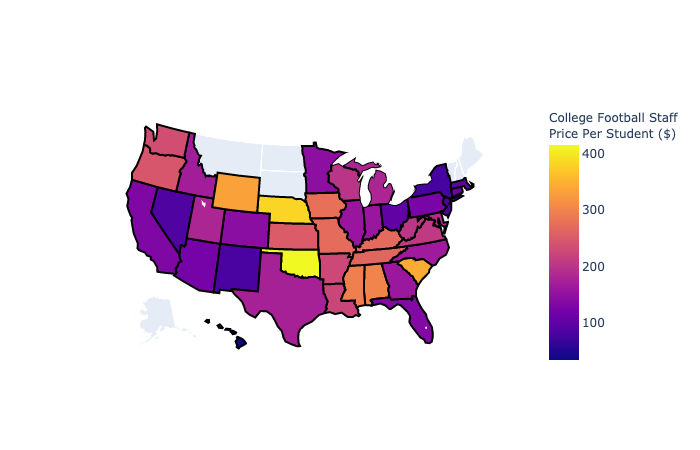
Oklahoma leads the nation as the state with the highest price per student at $415.21 across 3 schools (Oklahoma 4th, Oklahoma State 9th, and Tulsa 8th). Tulsa, in particular, is 8th in terms of price per student with a cost of $392.88. In the Top-25 poll of price per student, we find 9 schools from the SEC followed by 5 programs from the Big 12. The Big Ten and ACC each have 3 schools in the Top-25. The Pac 12 is the lowest of the power 5 conferences with only 2 schools. The group of 5 conferences contain 3 programs with a high price per student (2 in the American Conference and 1 in the Mountain West).
Thank you for reading this article. Follow me on Medium Cody Glickman and share this article with your college football friends. All the scripts and figures can be found on GitHub. My name is Cody Glickman and I can be found on LinkedIn.


Comments
Post a Comment